Streaming platforms have more than eight million artists and eighty million tracks. Sifting through that volume means having the right tool at your disposal. Here’s a peek at how Chartmetric can help you filter the noise.
Finding a needle in the haystack doesn’t have to be a monumental task–not with the right tools at your disposal. Ready for your metal detector? Chartmetric’s Artist & Track list filters give A&Rs the tools they need to find exactly the type of artist they want to develop. Meanwhile, their comparison features help A&Rs understand the kinds of investments they should be making.
How to Discover Artists
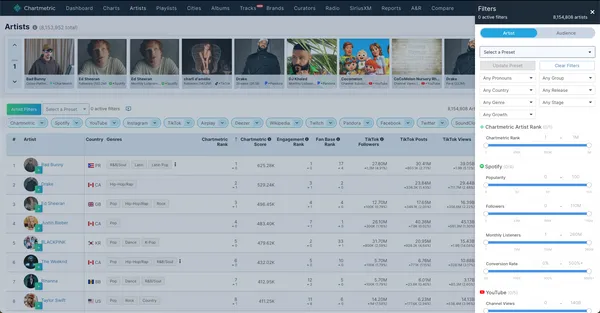
A&R execs usually have a rough idea of the type of talent they’re looking to develop. But Chartmetric’s Artist Filters button can help home in on talent scouting, just like using a metal detector for our metaphorical needle. A&Rs can sift through all 8M+ artists in the Chartmetric database across 52 different metrics from 18 different platforms. Let’s take a look at an example of how these filters work.
Are you looking for a developing artist who identifies as she/her and is currently experiencing explosive growth? Here’s how to find her using Chartmetric’s Artist Filters on the Artists List.
- Click the ‘Artist Filters’ button in the upper left-hand corner of the Artists List.
- Select ‘She/Her’ from the ‘Any Pronouns’ dropdown
- Select ‘Developing’ from the ‘Any Stage’ dropdown
- Select ‘Explosive Growth from the ‘Any Growth’ dropdown
- Click the ‘Select a Preset’ dropdown to save it as a Preset for future reference

How about an artist with a majority female audience in the 18-24 age range, based primarily in the UK?
- Click the ‘Audience’ toggle in the upper right-hand corner of the Artist Filters.
- Select the platform’s data you want to use (Twitter, YouTube, Instagram & more)
- Move the ‘Female’ slider to have a lower limit of 50%
- Under ‘Age,’ select 18-24 and move the slider to have a lower limit of 50%
- Scroll down to ‘Countries’ and select United Kingdom

Other data you can use to refine your results include audience ethnicity, language, and location, in addition to artists’ Spotify Popularity, YouTube Views, TikTok Engagement, Instagram Followers, SoundCloud Followers, Radio Spins, Pandora Streams, Deezer Fans, and Wikipedia Views.
A&Rs can use these filters to toggle between 7-day change and 28-day change to get a clear picture of growth.
How to Discover Tracks
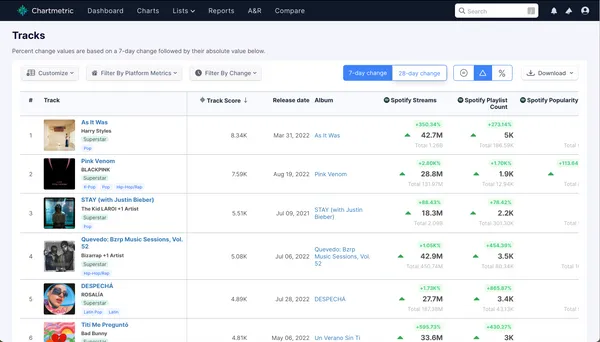
Talent discovery on TikTok is increasingly happening at the track level. Chartmetric gives the music industry the best way to find fast-rising tracks on any platform. The new tracks list allows A&R execs to sift through 80M+ tracks in the Chartmetric database across 20 different metrics and 11 different platforms.
What if you want to find a track by a developing artist that has shown huge Spotify streaming growth in the last week? Here’s how using Chartmetric’s Tracks List.
- Click ‘Filter by Platform Metrics’ and set your desired range of Spotify streams.
- Click ‘Filter by Change’ and set your desired range of growth.
- Click the ‘%’ icon in the upper righthand corner
- Sift through trending tracks from artists who might not yet be signed
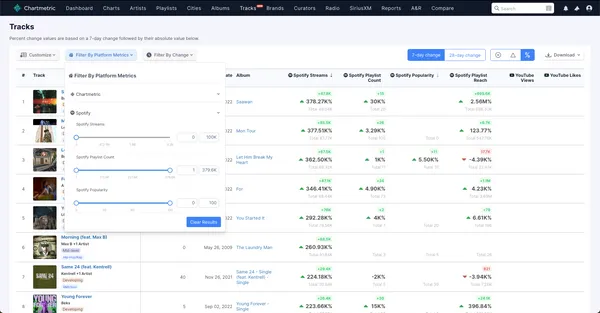
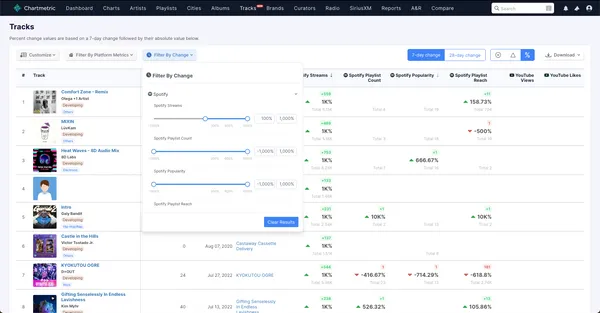
With Chartmetric, you can sort tracks by genre, artist, album, IRSC, release date, Chartmetric Track Score, Spotify Streams, YouTube Views, TikTok Posts, Radio Spins, SoundCloud Plays, Shazams, and more….
Shortlisting the Artists and Tracks You Want to Invest In
A&R doesn’t end at discovery. Recognizing which tracks and artists are the best long-term investments is a huge part of the role, and shortlisting the artists that you want to consider signing is easy with Chartmetric.
A quick way to examine how artists of interest perform across platforms is by using the Compare feature. This feature allows you to see what artists have grown the most across a number of different metrics, which is crucial, because long-term growth depends on the relationship between several metrics. Let’s take a look at an example.
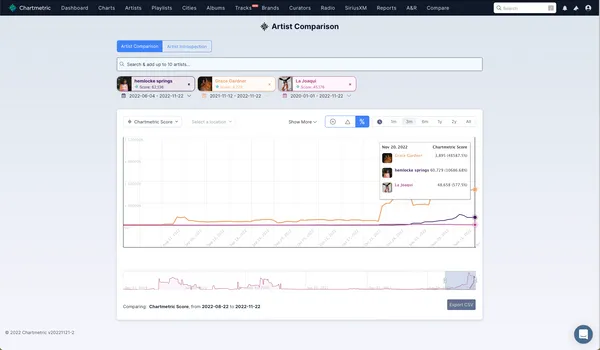
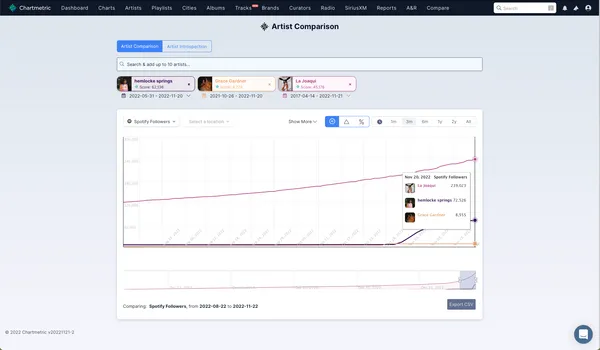
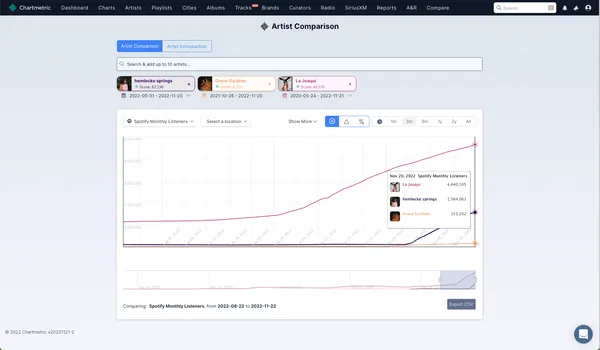
Of the three artists shown below, La Joaqui might have the biggest overall stats, but hemlocke springs has experienced the most meaningful growth in Spotify followers and Spotify monthly listeners. Grace Gardner, meanwhile, will require a closer look.
Let’s check out each of these artists’ tracks on various platforms. After all, one viral hit does not necessarily guarantee sustainable growth for the artist; however, two successful tracks might indicate promise.
In terms of Spotify streams, two of Grace Gardner’s top-streamed tracks are still showing growth potential. “Radio Silence” picked up steam even though it was released more than a year ago.
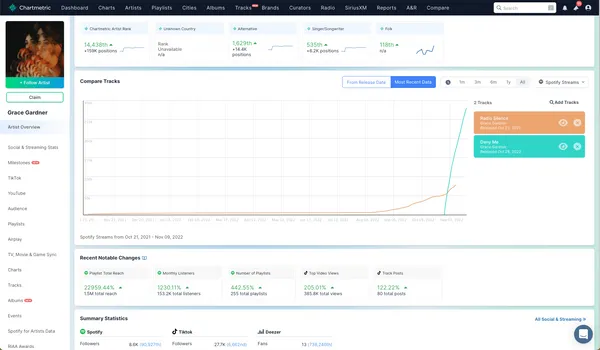
The same is true of hemlocke springs, whose earlier track, “gimme all ur luv,” is starting to get more traction as a result of another track, “girlfriend,” going viral.
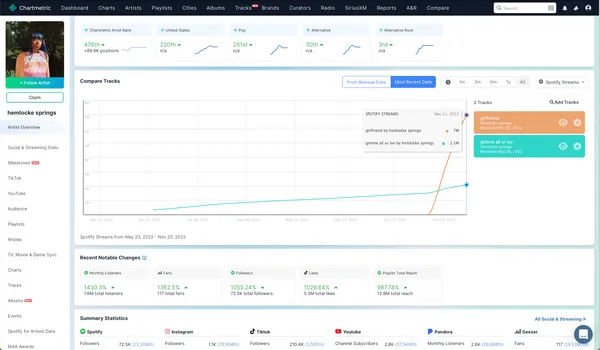
It’s important to compare each artist’s stats to each other–particularly engagement stats vs. fanbase stats. If an artist’s fanbase is growing in tandem with their engagement, that’s a great sign; if only their engagement is growing, then they’re not converting listeners to fans.
With hemlocke springs, we see that both her Spotify monthly listeners and Spotify followers are exhibiting 1200% growth, which is really healthy.
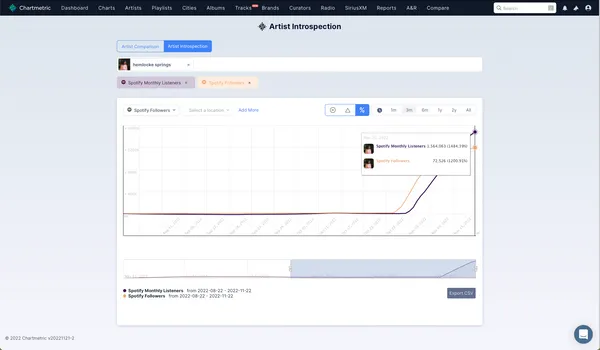
Grace Gardner–on the other hand–has off-the-charts Spotify monthly listeners growth, but her Spotify follower growth isn’t quite keeping pace. This isn’t necessarily a bad sign–since her followers are growing, but it is worth monitoring as she develops.
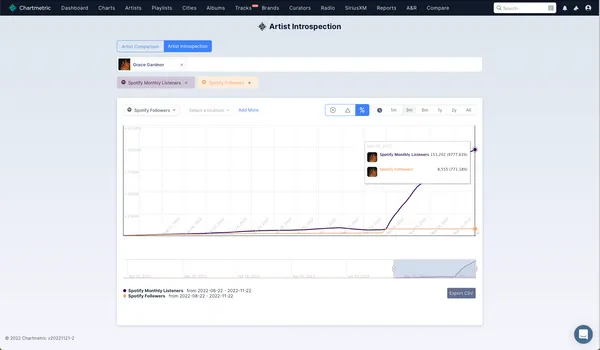
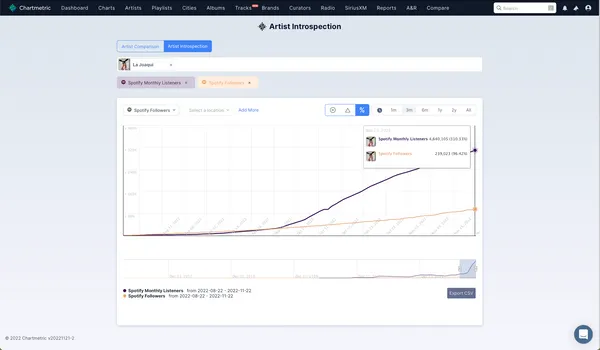
La Joaqui is a much bigger artist, which means there will naturally be less growth. For more developed artists like this, fan conversion becomes even more important, as the top artists usually have a fan conversion rate that approaches 1:1. That’s not the case with La Joaqui yet, as her Spotify monthly listeners have grown 3x more than her Spotify followers. With more music and a bigger audience at her disposal, she’s likely the safest bet among these three artists from an investment perspective.
While both Grace Gardner and hemlocke springs would be riskier investments, based on their growth metrics, they may be worth considering.

